Chapter 11
Packet Capture
11.1.1 Assumed Knowledge
11.1.2 Linux and Network Setup
11.2 Packet Capture Concepts
11.3 Capturing and Filtering with tcpdump
11.3.1 Capturing with tcpdump
11.3.2 Filtering Packets with tcpdump
11.4 Viewing and Analysing Packets with Wireshark
11.4.1 Viewing Captured Traffic
11.4.2 Analysis and Statistics
11.4.3 Filters
11.5 Capture Examples
11.5.1 Ping and ICMP
11.5.2 Web Browsing and HTTP
11.5.3 Netcat with TCP and UDP
11.5.4 Web Browsing to sandilands.info
11.5.5 Ping with Fragmented IP Datagrams
11.5.6 Tracepath with UDP and ICMP
This chapter introduces you to applications for capturing traffic on networks. By “capturing”, we mean record and view the details of every packet sent and received by the computer. We use two applications: tcpdump and Wireshark. Packet capture applications are useful to inspect the details of the network operations being performed by your computer (and the network), thereby used to diagnose problems. We will use often use packet capture to understand how protocols work.
11.1 Prerequisites
11.1.1 Assumed Knowledge
This chapter assumes you have knowledge of:
- Computer hardware and software organisation, including operating systems, applications and hardware devices, especially NICs.
- Layering concepts in data networking. A five-layer model is referred to: Application, Transport, Network, Data Link, Physical. However knowledge of other models, including seven-layer Open Systems Interconnection (OSI) is sufficient.
- Network protocols, including packet formats and operation of IP, TCP, ICMP and Ethernet.
Basic Linux command line skills, as covered in Chapter 4, are assumed. You will need to be able to:
- Perform operations on directories and files, including ls, cd, cp.
11.1.2 Linux and Network Setup
All of the practical tasks in this chapter can be completed on a single Linux computer, as long as it has Internet access. However you are recommended to use a virtual network when capturing traffic, to avoid potential legal/ethical issues of capturing other peoples traffic. You are recommended to use virtnet (Chapter 3), as it allows for quick deployment of the computers in a topology that allows capturing on computers separate from the client and application.
The recommended virtnet topology is:
11.2 Packet Capture Concepts
The implementation of protocol layers in a network device (computer, router, switch, etc.) is done in a mix of hardware and software. Typically the Physical and Data Link layer are implemented in hardware, e.g. on an Ethernet LAN card. Drivers are special pieces of software that provide an interface from the operating system to a specific hardware device. That is, the Ethernet driver provides the functions for your operating system to receive Ethernet frames (and put them into memory) from your LAN card. The operating system normally implements the Network and Transport layers in software: that is, there is a software process that implements IP, as well as separate processes to implement UDP, TCP, ICMP and other transport layer protocols. Finally, each individual application (like web browsers, email clients, instant messaging clients) implement the Application layer protocols (such as HTTP and Simple Mail Transfer Protocol (SMTP)), as well as the user functionality and interface specific to that application. Figure 11.1 illustrates the layers and their implementation.
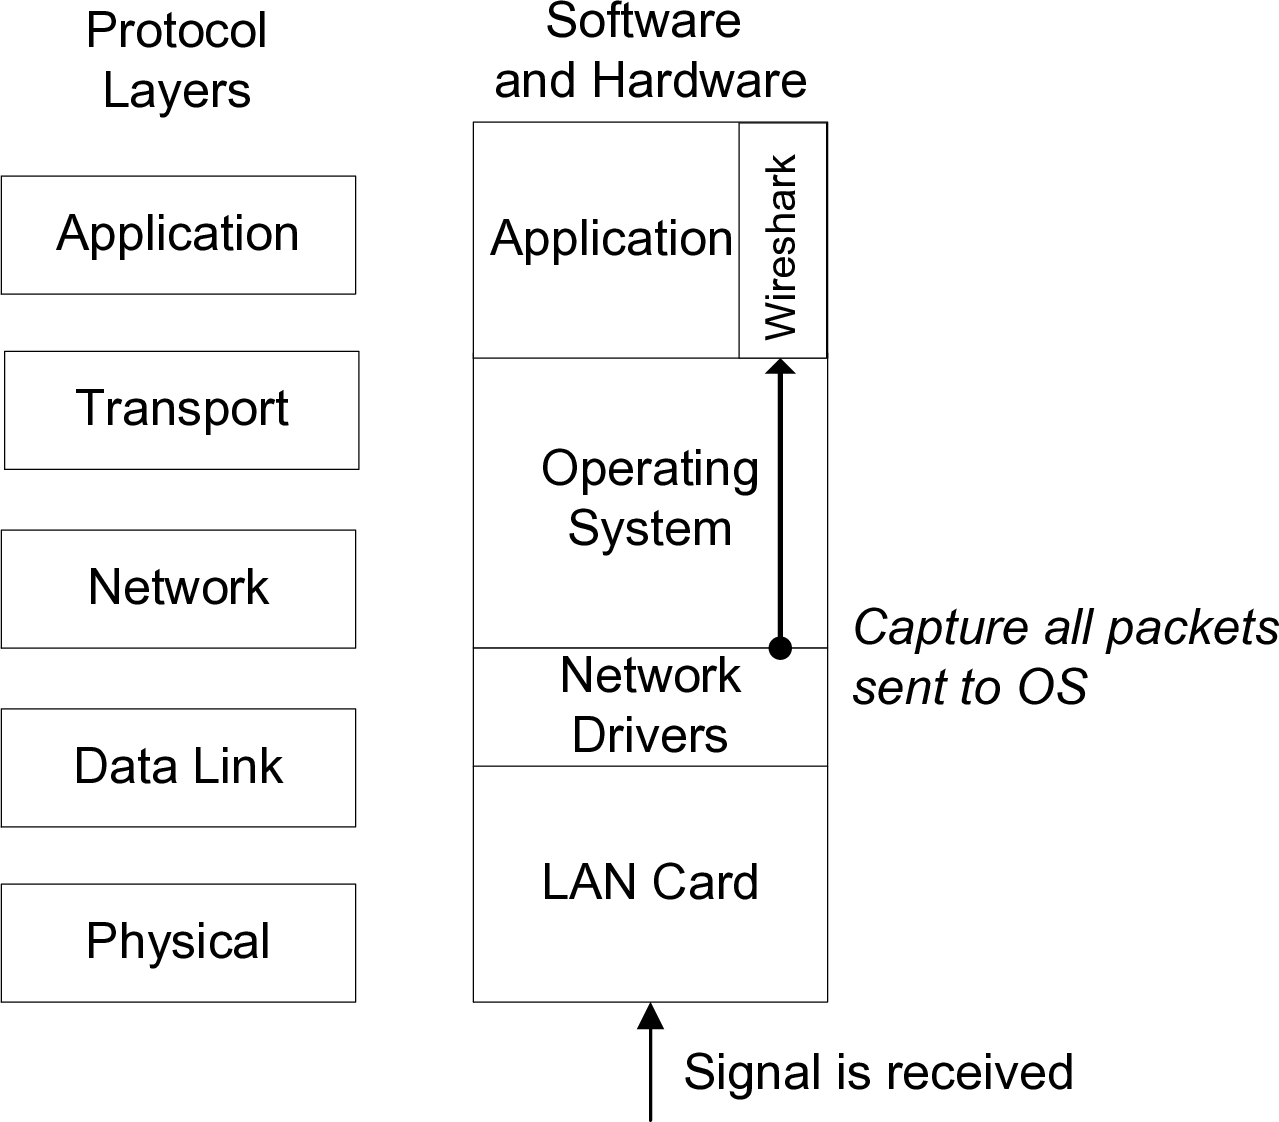
When a signal is received by your LAN card the signal is processed by the Physical and Data Link layers, and an Ethernet frame is passed to the operating system (via the Ethernet network driver). Normally the operating system will process the frame, sending it to the IP software process, which eventually sends the data to the transport layer protocol software process, which finally sends the data to your application.
In order to view all the frames received by your computer, we use special packet capture software, that allows all the Data Link layer frames sent from LAN card to operating system to be viewed by a normal application (in our case, tcpdump and Wireshark). The capturing of packets makes a copy of the exact packet received by your computer—it does not modify the original packet. This allows us to analyse data received by the computer, in order to perform various network management tasks (such as diagnose problems, measure performance, identify security leaks).
There are different applications available to capture packets. We will use a combination of tcpdump and Wireshark. We will capture packets with tcpdump, saving them to a file, and then view and analyse the saved packets with Wireshark. While Wirehshark can also capture packets, it is valuable to learn tpcdump for command line use. Also, capturing traffic in Linux is a privileged operation, meaning you must be root, administrator or sudo to perform a capture. It is good security practice to run as few applications as possible with root privileges, so one approach is to run tcpdump as root, and then run Wireshark as the normal user.
11.3 Capturing and Filtering with tcpdump
11.3.1 Capturing with tcpdump
To capture packets, on the command line use tcpdump. It accepts many different options; here we will show just a small selection.
To capture packets you must specify an INTERFACE, e.g. eth0, eth1 or wlan0. The following command shows how, and will print one line on the terminal for each packet captured:
$ sudo tcpdump -n -i INTERFACE
To stop the capture, press Ctrl-C. It will show a summary of the number of packets captured. The -n option shows numeric addresses, rather than human friendly addresses (explained in Section 9.8).
In many cases printing on the terminal is very hard to read, therefore you can write the packets to a file in a format that can be read by other applications (e.g. Wireshark):
$ sudo tcpdump -n -i INTERFACE -w FILENAME
This time there is no output, other than saying the capture has started. Again, stop with Ctrl-C. There should be a file called FILENAME created, which you can now open in Wireshark. The file extension commonly used is .pcap (or .cap in older versions).
Video: Packet capture with tcpdump (8 min; Aug 2016)
11.3.2 Filtering Packets with tcpdump
If you are not going to analyse with Wireshark (e.g. restricted to command line only, only want to quickly see packets), then you can use tcpdump to only capture certain packets. The capture filter syntax is quite powerful, yet complicated. Here we show just a few common examples. The man page for tcpdump includes more detailed examples.
These examples are performed on topology 5 in virtnet, with tcpdump running on node2 (the router in between node1 and node3). Although we won’t show the output here, you can observe the effect of the following capture filters by setting up two separate communications between node1 and node3.
On node1, ping node3:
network@node1:~$ ping 192.168.2.21
And on node3, use Secure Shell to connect to node1:
network@node3:~$ ssh 192.168.1.11
Now if you run tcpdump on node2 (interface eth1) you should see many packets captured, in particular ICMP and SSH related packets (make sure node3 is performing some operations via the SSH connection). Now let’s try some capture filters.
Capture only packets with a specified IP address:
network@node2:~$ sudo tcpdump -n -i eth1 'ip host 192.168.2.21'
While there will not be much difference, if we limit the IP address to just the source, you should notice less packets captured:
network@node2:~$ sudo tcpdump -n -i eth1 'src host 192.168.2.21'
Capture only the ICMP packets:
network@node2:~$ sudo tcpdump -n -i eth1 'icmp'
Capture only the SSH packets (port 22):
network@node2:~$ sudo tcpdump -n -i eth1 'tcp port 22'
11.4 Viewing and Analysing Packets with Wireshark
Wireshark is a free, open-source packet analysis application. It is a GUI-based application, which means if you are using a command-line only version of Linux (such as virtnet), Wireshark will not be available. However in this case you can normally install Wireshark on your host operating system (e.g. Windows), capture with tcpdump on Linux, and transfer the capture file from Linux to Windows to analyse in Wireshark. Section 3.3.4 demonstrates how to transfer files from a Linux guest in VirtualBox to a Windows host.
In this section we will assume you have a capture file, e.g. created by tcpdump, and can open it with Wireshark.
11.4.1 Viewing Captured Traffic
After a packet capture has been loaded, the main Wireshark window shows the captured packets (see an example in Figure 11.2). The window is split into three sections:
- The top section (packet list) showing the list of captured packets. Each packet has the
following information:
- Packet number (with respect to the total number of packets captured)
- Time the packet is captured, assuming the time the first packet captured is time 0.0
- The source and destination IP addresses of the packet
- The highest layer protocol associated with the packet
- Summary information about the information carried by the packet
- The middle section (individual packet details) showing detailed information about the packet selected in the top section. This is separated based on the layers of the packet.
- The bottom section (individual packet bytes) showing the hexadecimal and ASCII representations of the packet data.
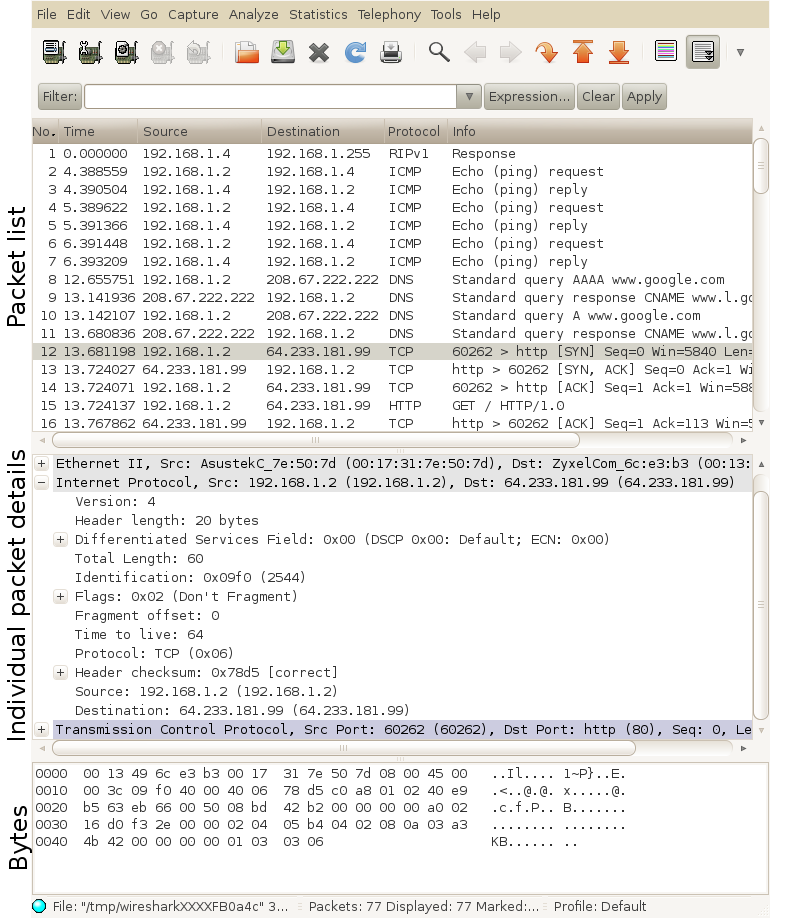
When selecting the 12th packet (in the top section), and then selecting the Internet Protocol (in the middle section), the values of the IP datagram header fields are shown. When selecting Transmission Control Protocol (in the middle section), the bottom section shows the TCP header bytes (in hexadecimal and ASCII).
Video: Viewing Captured Packets in Wireshark (10 min; Aug 2016)
11.4.2 Analysis and Statistics
Wireshark has many in-built statistics that allow you to analyse the captured packets. This is very useful, especially if you have many packets captured (1000’s to millions). You should explore (that is, view them and try to understand what they show) the following from the Statistics menu:
- Summary
- Protocol Hierarchy
- Conversations
- Flow Graph
- HTTP
- Packet Length
- TCP Stream Graph
11.4.3 Filters
The example used above was for a small trace of less than 100 packets captured over 10 seconds. When capturing over a long time period (and hence thousands or hundreds of thousands of packets), it is often desirable to investigate a selected portion of the packets (for example, packets between certain pairs of hosts, or using a particular protocol). Hence filters can be applied during the packet capture (such that only packets that meet the specified criteria are captured - called capture filters as in Section 11.3.2) or after the capture (such that analysis is only performed on packets that meet the specified criteria - called display filters). Here we will look at display filters.
Display filters are used mainly to view certain types of packets. They make analyzing the data easier. One place you can enter a display filter is just above the top (packet list) section. You can either type in the filter and press Apply or create the filter using the Expression command. Some example filters are given below.
The following filter can be used to display only packets that have source or destination IP address of 10.10.1.171
ip.addr==10.10.1.171
The next filter can be used to display only packets that have IP 10.10.1.127 and do not have a TCP port address of 8080.
ip.addr==10.10.1.127 && !tcp.port==8080
The next filter displays only ICMP packets.
icmp
The next filter displays only packets exchanged with a web server (assuming the web server is using port 80).
tcp.port==80
Table 11.1 summarises some general filters you may use in ths book, while Table 11.2 gives some filters when looking for IEEE 802.11 (WiFi) packets. Note that the examples used demonstrate different conditions (==, !=, …) and address formats (e.g. 10.10.6.0/24 for a subnet). Further details of the display filter language and where it can be applied can be found in the Wireshark manual. Specifically, the display filter reference lists all filters, including: Ethernet, IP, TCP, HTTP, Wireless LAN and Wireless LAN Management.
| Task | Filter | Example |
| IP address, src or dest | ip.addr | ip.addr==10.10.6.210 |
| IP address, src only | ip.src | ip.src!=10.10.6.210 |
| IP address, dest only | ip.dst | ip.dst==10.10.6.0/24 |
| Ethernet address | eth.addr | eth.addr==00:23:69:3a:f4:7d |
| TCP (or UDP) port | tcp.port | tcp.port==80 |
| UDP (or TCP) dest port | udp.dstport | udp.dstport<100 |
| Show packets that use | protocol | http |
| a particular protocol | icmp | |
| bootp | ||
| dns | ||
| HTTP request | http.request | http.request |
| HTTP POST request | http.request.method | http.request.method==POST |
| Task | Filter | Example |
| WLAN frames | wlan | wlan |
| Address | wlan.addr | wlan.addr==00:26:5e:8e:e4:95 |
| Transmitter | wlan.ta | wlan.ta==00:26:5e:8e:e4:95 |
| Src, Dst. | wlan.srcaddr | wlan.srcaddr==00:26:5e:8e:e4:95 |
| Channel | wlan.channel | wlan.channel==6 |
| Frequency | wlan.channel_frequency | wlan.channel_frequency==2412 |
| SSID | wlan_mgt.ssid | wlan_mgt.ssid=="wsiit" |
| Frame Type | wlan.fc.type | wlan.fc.type==0 |
| Frame Subtype | wlan.fc.subtype | wlan.fc.type==0 |
| Beacon frame | wlan.fc.type==0 && | |
| wlan.fc.subtype==8 | ||
| Frame Type | Frame Subtype | Type, Subtype |
| Management | Assoc. Request | 0, 0 |
| Management | Assoc. Response | 0, 1 |
| Management | Reassoc. Request | 0, 2 |
| Management | Reassoc. Response | 0, 3 |
| Management | Probe Request | 0, 4 |
| Management | Probe Response | 0, 5 |
| Management | Beacon | 0, 8 |
| Management | Authentication | 0, 11 |
| Management | Deauthentication | 0, 12 |
| Control | RTS | 1, 11 |
| Control | CTS | 1, 12 |
| Control | Ack | 1, 13 |
| Data | Data | 2, 0 |
11.5 Capture Examples
The Wireshark Wiki contains many sample captures that you can download and analyse in Wireshark. You do not need to perform the capture yourself.
The following sections include videos and/or actual .pcap capture files for some common protocols used in my subjects. The videos show how to perform the capture with tcpdump and analyse in Wireshark. If you cannot perform the capture yourself, you can download the .pcap files.
11.5.1 Ping and ICMP
Using topology 5 in virtnet, node1 pinged node3, while capturing on node2 (the router).
Video: Capturing Ping in a Virtual Linux Network (8 min; Feb 2017)
Video: Analysing Ping with Wireshark (19 min; Feb 2017)
11.5.2 Web Browsing and HTTP
Using topology 5 in virtnet, node1 browsed to a web server on node3, while capturing on node2 (the router).
Video: Capturing Web Browsing in a Virtual Linux Network (7 min; Feb 2017)
Video: Analysing Web Traffic in a Virtual Linux Network (11 min; Feb 2017)
11.5.3 Netcat with TCP and UDP
Using topology 5 in virtnet, node3 ran a netcat (nc) server, while node1 ran a netcat client. node2 captured. There are two examples, the first when netcat with TCP is used, and the second with UDP.
Video: Netcat and TCP in a Virtual Linux Network (19 min; Feb 2017)
Video: Netcat and UDP in a Virtual Linux Network (14 min; Feb 2017)
11.5.4 Web Browsing to sandilands.info
A laptop with IP 192.168.1.7 browsed a real website, sandilands.info, first using HTTP and then HTTP Secure (HTTPS). The second, simple capture file is extracted from the first, except it only shows the HTTP exchange and IPv4 DNS packets (the other packets were deleted from the file).
11.5.5 Ping with Fragmented IP Datagrams
Computer 192.168.1.2 is pinging 192.168.1.1 with different size data such that the IP datagram is fragmented.
11.5.6 Tracepath with UDP and ICMP
A tracepath is performed from 192.168.1.2 illustrating how tracepath uses a combination of UDP and ICMP.