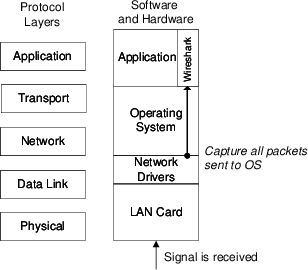
Figure 3.1: Capturing packets in the Operating System
File: Steve/Courses/2014/s2/its332/wireshark.tex, r3463
This lab will introduce you to an application for capturing traffic on networks. By “capturing”, we mean record and view the details of every packet sent and received by the computer. We use two applications: tcpdump and Wireshark1 . Packet capture applications are useful to inspect the details of the network operations being performed by your computer (and the network), thereby used to diagnose problems. We will use often use it in labs to understand how protocols work.
The implementation of protocol layers in a network device (computer, router, switch, etc.) is done in a mix of hardware and software. Typically the Physical and Data Link layer are implemented in hardware, e.g. on an Ethernet LAN card. Drivers are special pieces of software that provide an interface from the operating system to a specific hardware device. That is, the Ethernet driver provides the functions for your operating system to receive Ethernet frames (and put them into memory) from your LAN card. The operating system normally implements the Network and Transport layers in software: that is, there is a software process that implements IP, as well as separate processes to implement UDP, TCP, ICMP and other transport layer protocols. Finally, each individual application (like web browsers, email clients, instant messaging clients) implement the Application layer protocols (such as HTTP and SMTP), as well as the user functionality and interface specific to that application. Figure 3.1 illustrates the layers and their implementation.
When a signal is received by your LAN card the signal is processed by the Physical and Data Link layers, and an Ethernet frame is passed to the operating system (via the Ethernet network driver). Normally the operating system will process the frame, sending it to the IP software process, which eventually sends the data to the transport layer protocol software process, which finally sends the data to your application.
In order to view all the frames received by your computer, we use special packet capture software, that allows all the Data Link layer frames sent from LAN card to operating system to be viewed by a normal application (in our case, tcpdump and Wireshark). The capturing of packets makes a copy of the exact packet received by your computer—it does not modify the original packet. This allows us to analyse data received by the computer, in order to perform various network management tasks (such as diagnose problems, measure performance, identify security leaks).
There are different applications available to capture packets. We will use a combination of tcpdump and Wireshark. We will capture packets with tcpdump, saving them to a file, and then view and analyse the saved packets with Wireshark2 .
To capture packets, on the command line use tcpdump. It accepts many different options; here we will show just a small selection.
To capture packets you must specify an INTERFACE, e.g. eth0, eth1 or wlan0. The following command show how, and will print one line on the terminal for each packet captured:
To stop the capture, press Ctrl-C. It will show a summary of the number of packets captured.
In many cases printing on the terminal is very hard to read, therefore you can write the packets to a file in a format that can be read by other applications (e.g. Wireshark):
This time there is no output, other than saying the capture has started. Again, stop with Ctrl-C. There should be a file called FILENAME created, which you can now open in Wireshark.
Wireshark is a free, open-source packet analysis application. It should already be install on lab computers; you may also download and install on your own computer.
Open Wireshark from the Ubuntu menu or by typing wireshark on the command line. Load the file that was created by tcpdump.
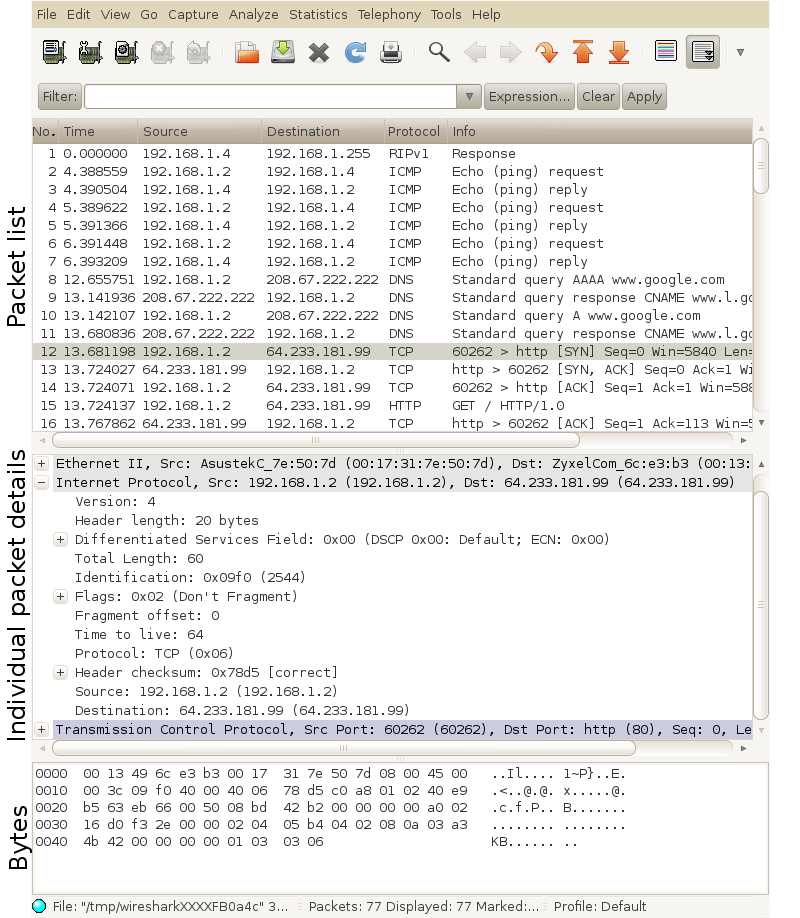
After a packet capture has been loaded, the main Wireshark window shows the captured packets (see example in Figure 3.2). The window is split into three sections:
When selecting the 12th packet (in the top section), and then selecting the Internet Protocol (in the middle section), the values of the IP datagram header fields are shown. When selecting Transmission Control Protocol (in the middle section), the bottom section shows the TCP header bytes (in hexadecimal and ASCII).
Wireshark has many in-built statistics that allow you to analyse the captured packets. This is very useful, especially if you have many packets captured (1000’s to millions). You should explore (that is, view them and try to understand what they show) the following from the Statistics menu:
The example used above was for a small trace of less than 100 packets captured over 10 seconds. When capturing over a long time period (and hence thousands or hundreds of thousands of packets), it is often desirable to investigate a selected portion of the packets (for example, packets between certain pairs of hosts, or using a particular protocol). Hence filters can be applied during the packet capture (such that only packets that meet the specified criteria are captured - called capture filters) or after the capture (such that analysis is only performed on packets that meet the specified criteria - called display filters). In this course there is no reason for you to use capture filters, instead you can use display filters.
Display filters are used mainly to view certain types of packets. They make analyzing the data easier. One place you can enter a display filter is just above the top (packet list) section. You can either type in the filter and press Apply or create the filter using the Expression command. Some example filters are given below.
The following filter can be used to display only packets that have source or destination IP address of 10.10.1.171
The next filter can be used to display only packets that have IP address of 10.10.1.127 and do not have a TCP port address of 8080.
The next filter displays only ICMP packets.
The next filter displays only packets exchanged with a web server (assuming the web server is using port 80).
Table 3.1 summarises some general filters you may use in the lab, while Table 3.2 gives some filters when looking for IEEE 802.11 (WiFi) packets. Note that the examples use demonstrate different conditions (==, !=, …) and address formats (e.g. 10.10.6.0/24 for a subnet). Further details of the display filter language and where it can be applied can be found in the Wireshark manual. Specifically, the display filter reference lists all filters, including: Ethernet, IP, TCP, HTTP, Wireless LAN and Wireless LAN Management.
| Task | Filter | Example |
| IP address, source or dest. | ip.addr | ip.addr==10.10.6.210 |
| IP address, source only | ip.src | ip.src!=10.10.6.210 |
| IP address, dest. only | ip.dst | ip.dst==10.10.6.0/24 |
| Ethernet address | eth.addr | eth.addr==00:23:69:3a:f4:7d |
| TCP (or UDP) port | tcp.port | tcp.port==80 |
| UDP (or TCP) dest. port | udp.dstport | udp.dstport<100 |
| Show packets that use a | protocol | http |
| particular protocol | icmp | |
| bootp | ||
| dns | ||
| HTTP request | http.request | http.request |
| HTTP POST request | http.request.method | http.request.method==POST |
| Task | Filter | Example |
| WLAN frames | wlan | wlan |
| Address | wlan.addr | wlan.addr==00:26:5e:8e:e4:95 |
| Transmitter | wlan.ta | wlan.ta==00:26:5e:8e:e4:95 |
| Src, Dst. | wlan.srcaddr | wlan.srcaddr==00:26:5e:8e:e4:95 |
| Channel | wlan.channel | wlan.channel==6 |
| Frequency | wlan.channel_frequency | wlan.channel_frequency==2412 |
| SSID | wlan_mgt.ssid | wlan_mgt.ssid=="wsiit" |
| Frame Type | wlan.fc.type | wlan.fc.type==0 |
| Frame Subtype | wlan.fc.subtype | wlan.fc.type==0 |
| Beacon frame | wlan.fc.type==0 && | |
| wlan.fc.subtype==8 | ||
| Frame Type | Frame Subtype | Type, Subtype |
| Management | Assoc. Request | 0, 0 |
| Management | Assoc. Response | 0, 1 |
| Management | Reassoc. Request | 0, 2 |
| Management | Reassoc. Response | 0, 3 |
| Management | Probe Request | 0, 4 |
| Management | Probe Response | 0, 5 |
| Management | Beacon | 0, 8 |
| Management | Authentication | 0, 11 |
| Management | Deauthentication | 0, 12 |
| Control | RTS | 1, 11 |
| Control | CTS | 1, 12 |
| Control | Ack | 1, 13 |
| Data | Data | 2, 0 |
You should use tcpdump and Wireshark when you need to understand how a protocol works or to diagnose a problem for applications in a network. For the following tasks you should understand the purpose of each of the packets captured. You should illustrate a message sequence diagram (see Section 1.3.2) as well as important packets captured (see Section 1.3.3).
Task 3.1. Capture packets when “pinging” another computer. Understand how ping works from the packet capture.
Task 3.2. Capture packets transferred while browsing a selected website (e.g. a page from the course website, a search engine home page). Investigate the protocols used in each packet, the values of the header fields and the packet sizes.
Task 3.3. Explore at least the following features of Wireshark: filters, Flow Graphs (TCP), statistics, protocol hierarchies.