OPNET IT Guru Academic Edition is available for free from OPNET. You may follow their procedures for applying and installing IT Guru. However, as I have a copy (and registered a license on behalf of SIIT) it may be easier to follow these steps:
From here on, I will refer to OPNET IT Guru Academic Edition as simple IT Guru.
Once you have started IT Guru you can open a project from the File->Open... menu. For this demo, I will use the project ITS413_WLAN_Simple. The Project window showing two nodes will be displayed.
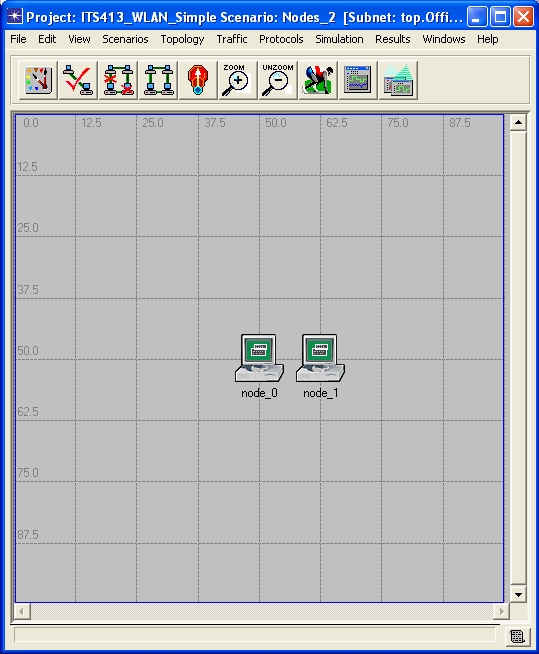
The Project window is the main area where you create the network, configure and run the simulation and view the results. Currently there are two nodes in the demo network: node_0 and node_1. They look like computers, and as we will see shortly they are models of computers with wireless LAN interfaces.
To create a network topology you place objects, which are typically nodes (computers, routers, switches, servers, ...) or links (e.g. Ethernet or optical cable), in the main window. You can select objects from the Object Palette. Go to Topology->Open Object Palette to bring up the palette.
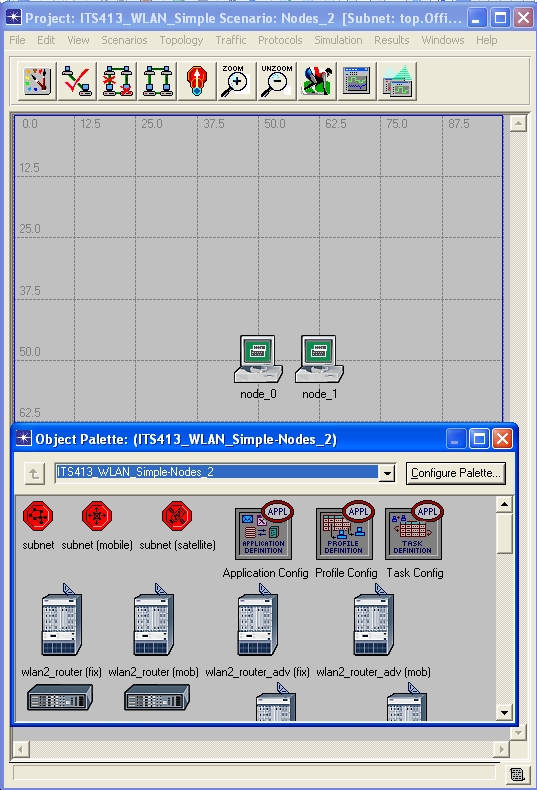
For this demo there is no need to add any new objects. But you may practice, and then delete the objects. Then close the Object Palette.
Once the network topology is created you should configure the nodes and links by editing their attributes. For the demo we have two nodes. Right click on node_0 and select Edit Attributes.
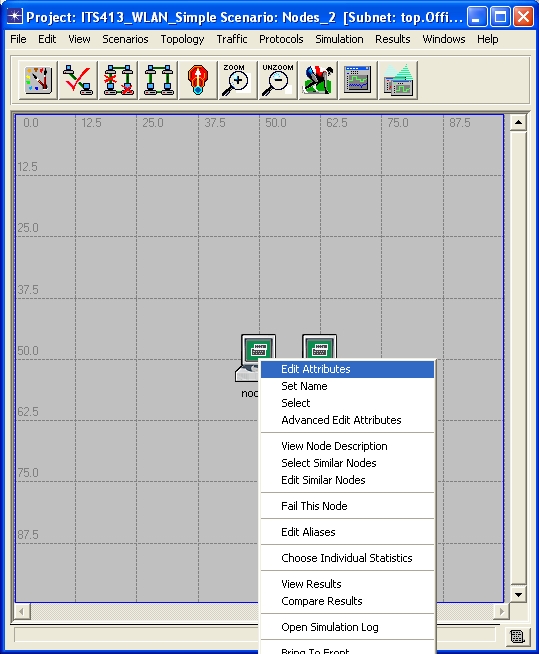
A list of attributes for that node are shown, along with the values of each attribute. The attributes can expand/collapse (click on the + plus sign). The first two attributes are common to all objects: name and model. The remaining attributes are dependant on the model. Note that node_0 uses the model wlan_station_adv. This means node_0 represents an wireless LAN station (advanced model). You can change the attributes by clicking on the value.
Lets take a closer look at the Traffic Generation Parameters.
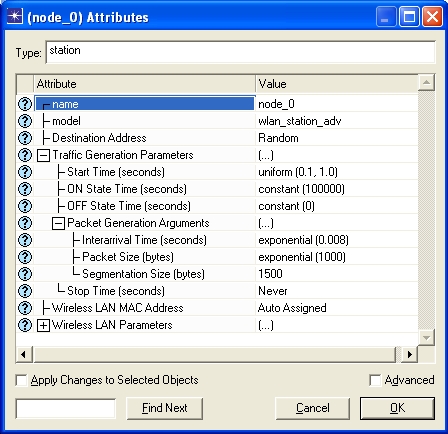
We can specify the characteristics of traffic that this node generates. The parameters are:
The above parameters can be used to model a simple application that sends packets (no responses). On average node_0 will generate 1Mb/s. Lets say you wanted to change the interarrival time so that node_0 generated traffic at a rate of 0.5Mb/s. Select the interarrival value and a window will pop up.
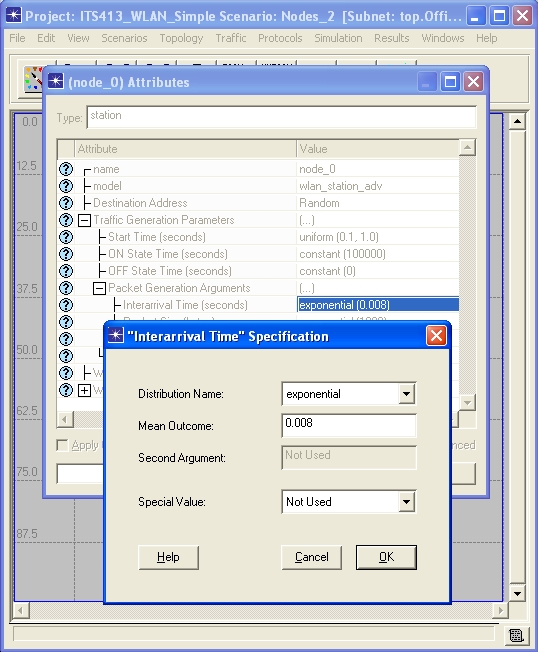
You can change the mean outcome (says to 0.004 seconds), as well as the distribution. If you do make a change, then before you continue, revert back to the original values for the remainder of the demo (exponential(0.008)).
Now lets look at the WLAN parameters.
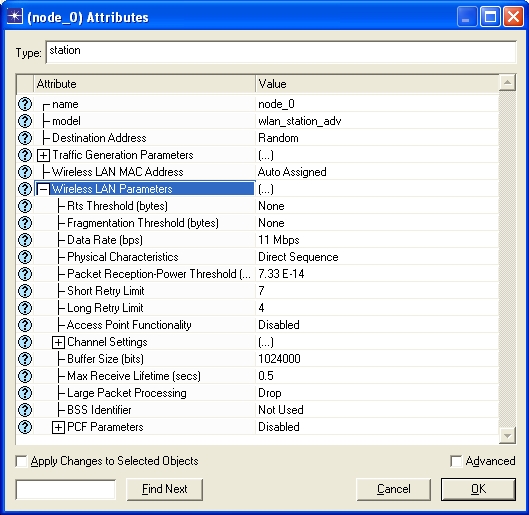
Some of the parameters you will recognise from their names. You can click on the question mark (?) next to the parameter to see a description. The ones of interest to us at the moment are: Data Rate (11Mb/s); Rts Threshold (None, meaning RTS/CTS is not used); Buffer Size (approximately 1Mb).
For our demo, you don't need to make any changes (the values I have chosen are sufficient). You can take a look at node_1 attributes - they should be identical to node_0. Now we need to choose the statistics that we want to collect and run the simulation.
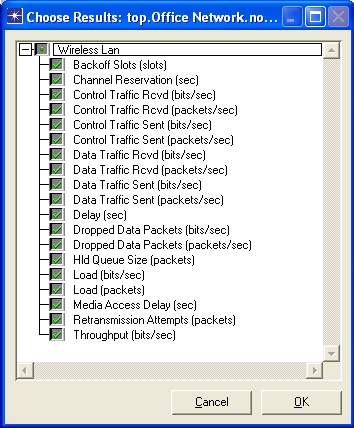
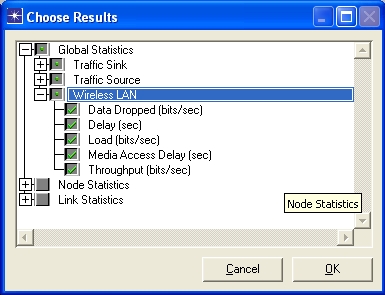
When we run the simulation IT Guru will simulate the applications generating traffic and subsequent communications between the two nodes. We are interested in measuring the performance of the applications, nodes and entire network. To do so, we must specify statistics that we want IT Guru to collect when the simulation runs. There are two main types of statistics that we are interested in.
Now that the statistics are chosen, we are ready to run a simulation.
To configure a simulation select Simulation->Configure Discrete Event Simulation....
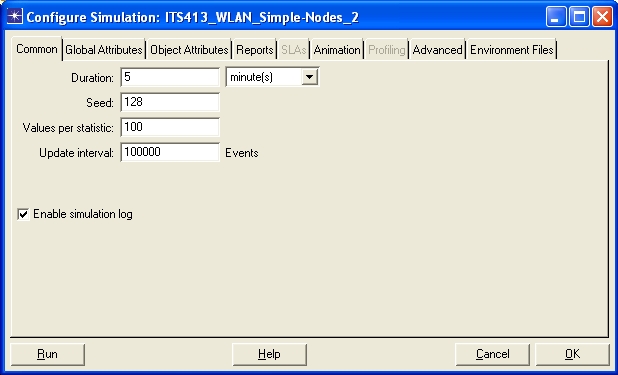
The default options are usually sufficient except you may need to change the duration and the seed for some scenarios. The duration is the simulation time: for example you want to simulate two wireless LAN nodes sending packets to each other for 5 minutes. In real-time it may only take several seconds. The seed is the random seed used in the simulation. If you change the seed a different sequence of events may occur. For example, if you repeat the simulation of one scenario using the same seed, the results should be exactly the same. But if you change the seed, the results will most likely be (slightly) different, even with the same scenario.
The Academic Edition has a limitation on the number of events it can simulation (50 million). If you run a simulation and a warning is produced indicating the total events exceeded the limit for Academic Edition, then you may try with a shorted simulation duration (e.g. 4 minutes instead of 5 minutes).
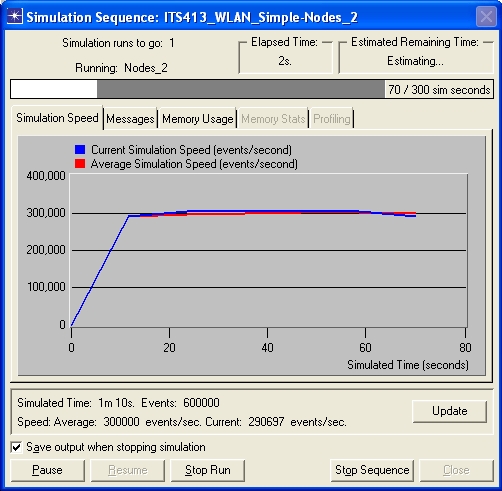
To start the simulation, press the Run button. IT Guru will simulate the network, showing you the progress (number of events per second it is calculating).
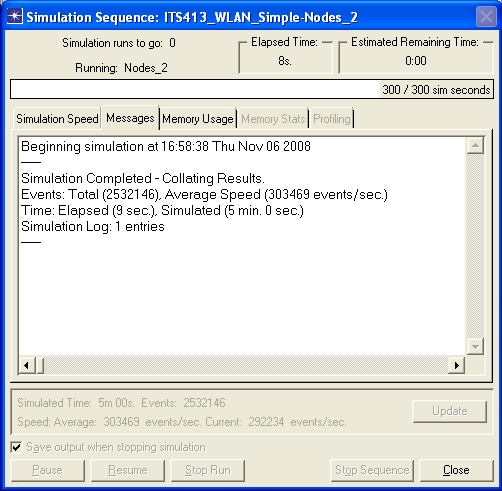
Once the simulation is complete a summary of the messages will be listed, after which you can Close the window.
Now that the simulation is complete you can view the results (statistics) by selecting Results->View Results from the menu.
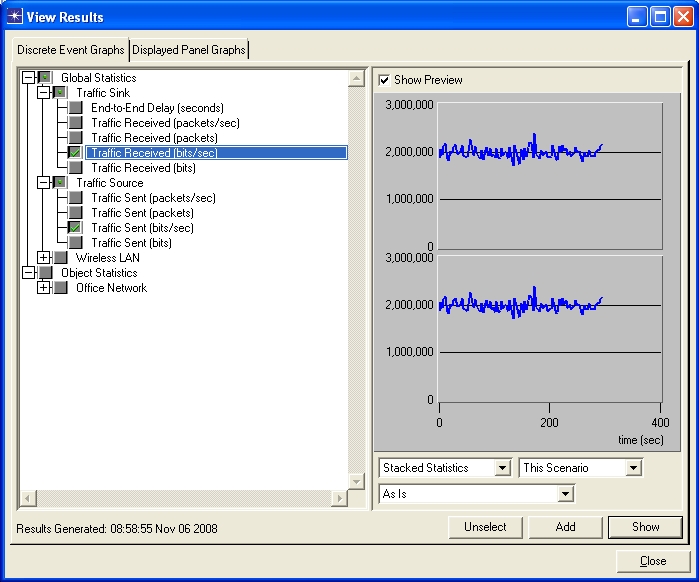
You can select the statistics that you want to display on the left, and see a preview on the right. Press the Show button to see the actual plot of results.
By default, all statistics are shown against time. For example, if the simulation runs for 5 minutes (300 seconds), the Traffic Sent statistic shows the measured traffic sent (in bits per second) at each time point (the time points are part of the simulation configuration). Be careful when you interpret what the plots mean. Often there will be some start-up phase, after which the results will reach a steady-state. Make sure you can identify the two. Also, note that the statistics are absolute values versus time. Often you only want to know the average for the entire simulation. In most cases you can estimate the average from the plot. However for more accurate results, you may try displaying an average (instead of absolute) value. You can do so by selecting the display type in the preview window on the right. Select As Is, and change it to average or another type, select Show and observe the difference.
After you show the results, when you close them you are given the option to either Delete or Hide. If you hide the window, then you can view it again be selecting from the menu: Results->Panels or Results->Arrange Panels->Show All.
Within a single project you may have muliple scenarios. For example, you may have one network topology (scenario) with 2 nodes and then another with 5 nodes. You can create new scenarios, duplicate existing ones and switch between scenarios via the Scenarios menu.
Return to: Course List | Steven Gordon's Home | SIIT