I will illustrate some of the Scilab functions for Assignment 1. I assume you have Scilab installed and running and you have loaded assignment1.sci into Scilab.
First, lets create some input digital data from a string:
-->name = 'Steve';

-->name_bin = text2bin(name)
 name_bin  =

         column  1 to 12

    1.    0.    1.    0.    0.    1.    1.    1.    1.    1.    0.    1.

         column 13 to 24

    0.    0.    1.    1.    0.    0.    1.    0.    1.    1.    1.    1.

         column 25 to 35

    0.    1.    1.    0.    1.    1.    0.    0.    1.    0.    1.
A string is simply text enclosed in single quotes. I then used the function text2bin() to convert the string to an array of binary values text2bin() is part of assignment1.sci (if you receive an error like Undefined variable: text2bin then you probably have not loaded assignment1.sci into Scilab). The function takes each character of the input string, converts to a 7-bit ASCII value and writes the binary values to an array. Here the array is a matrix with 1 row and 35 columns (1 column for each bit). The first 7 bits, 1010011 is 83 in decimal, which is the ASCII Code for the character 'S'.
Now lets convert the 35 bits of digital data into a signal using NRZ-Level:
-->[out_signal,signal_rate] = ds_nrzl_encode(name_bin,2);
The function ds_nrzl_encode() takes the digital data and encodes into a signal with a data rate of 2 bits per second. There are two outputs: a matrix represeting the signal (out_signal) and the signal rate. If you look at the matrix out_signal you will find the first column is the time of a signal point, and the second column is the signal value at that time (e.g. +1 or -1). A separate function for NRZ-Invert-on-Ones is also provided.
Now lets plot the digital signal:
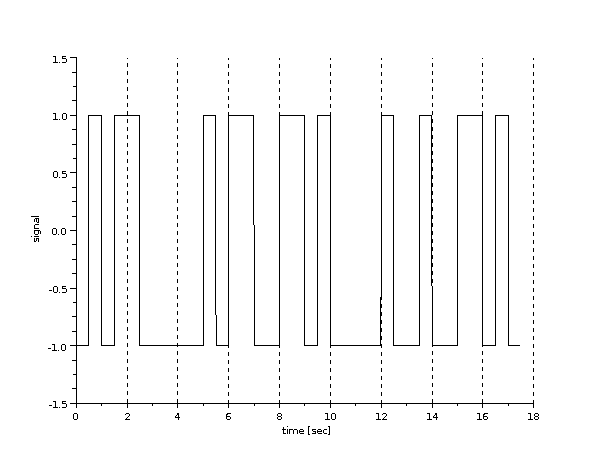
-->as_plot(out_signal);
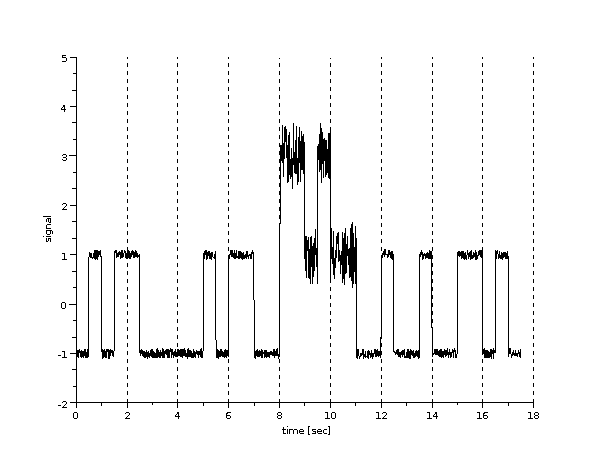
A plot is displayed like the one below. You can see that at 2b/s, the 35 bits are shown as a digital signal for 17.5 seconds.
You can save the plot to a file (e.g. PNG) using the xs2png() function. clf simply clears the current figure (in preparation for plotting new figures).
-->xs2png(0,'steve-scilab-plot-1.png');
-->clf;
Consider the output digital signal as the transmitted signal. Now lets add some noise to the transmitted signal to determine the signal received by the receiver. There are functions for two types of noise: uniform random noise and impulse noise.
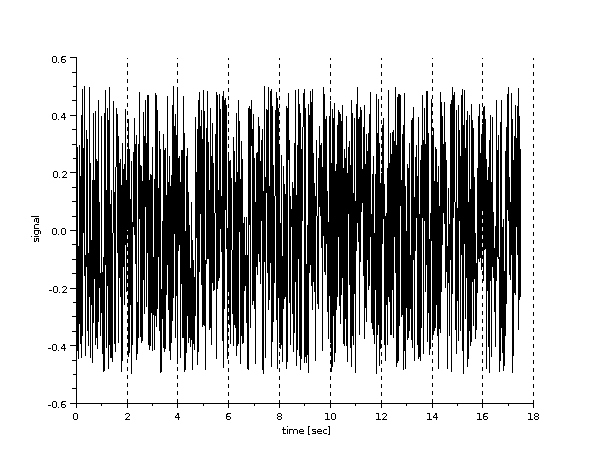
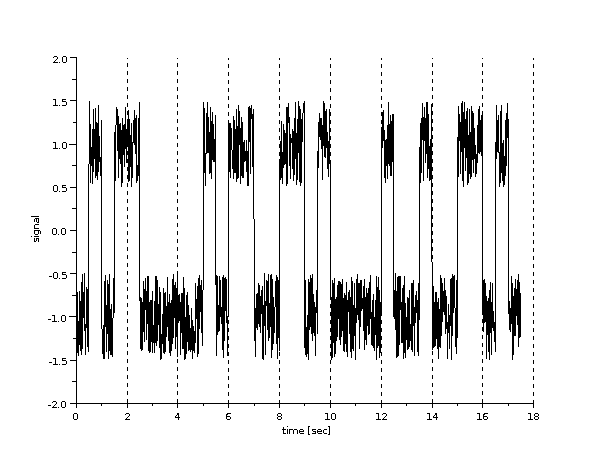
-->[rx_signal,uniform_noise] = add_uniform_noise(out_signal,0.5);

-->as_plot(uniform_noise);

-->clf;

-->as_plot(rx_signal);
The function add_uniform_noise() adds random noise to the signal, returning two values: the uniform noise and the input signal plus the uniform noise. The noise is created by choosing random numbers from a uniform distribution from -0.5 to +0.5 (assuming 0.5 is the input to the function - you may experiment with different noise amplitudes, e.g. 1, 2, 10). The effect is best illustrated by plots of the noise and received signal:
Now lets decode the received signal using ds_nrzl_decode():
-->[rx_data,data_rate] = ds_nrzl_decode(rx_signal,signal_rate)
 data_rate  =

    2.
 rx_data  =


         column  1 to 12

    1.    0.    1.    0.    0.    1.    1.    1.    1.    1.    0.    1.

         column 13 to 24

    0.    0.    1.    1.    0.    0.    1.    0.    1.    1.    1.    1.

         column 25 to 35

    0.    1.    1.    0.    1.    1.    0.    0.    1.    0.    1.
You can manually compare the received data (rx_data) with the original data (name_bin). Are they the same? To automatically compare, you can count the number of bit errors (or the bit error rate, which is the number of bit errors divided by the total number of bits):
-->[ber,num_errors] = bit_error_rate(name_bin,rx_data)
 num_errors  =

    0.
 ber  =

    0.
No errors (BER = 0). Thats good.
Now lets consider the effects of impulse noise. This is a large spike of noise over a short duration.
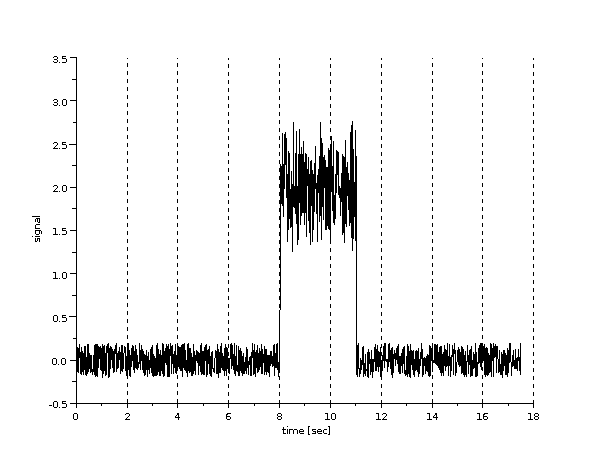
-->[rx_signal,impulse_noise] = add_impulse_noise(out_signal,2,3);
An impulse of duration 3 seconds with amplitude (+ or -) 2 is created and added to out_signal. If you plot impulse_noise you will notice there is also a small amount of uniform noise also generated (consider this background noise). The location of the impulse is randomly chosen, as is the amplitude of the impulse (+ or -). Therefore if you call add_impulse_noise() again you will obtain different impulse. (Also note that if you perform these exact steps on your computer you will get different noise than in the example shown below).
Now lets consider the impact of the impulse noise on the transmitted signal by decoding the received signal and calculating the bit error rate:
-->[rx_data,data_rate] = ds_nrzl_decode(rx_signal,signal_rate)
 data_rate  =

    2.
 rx_data  =


         column  1 to 12

    1.    0.    1.    0.    0.    1.    1.    1.    1.    1.    0.    1.

         column 13 to 24

    0.    0.    1.    1.    0.    0.    0.    0.    0.    0.    1.    1.

         column 25 to 35

    0.    1.    1.    0.    1.    1.    0.    0.    1.    0.    1.

-->[ber,num_errors] = bit_error_rate(name_bin,rx_data)
 num_errors  =

    3.
 ber  =

    0.0857143
Now we notice 3 errors (out of a total of 35 bits; BER = 0.0857143). Bits 19, 21 and 22 have changed from a 0 to a 1. In the assignment you should experiment with using different duration of the impulse and different data rates. In this example I used a data rate of 2 bits per second and an impulse duration of 3 seconds. In your assignment the original data rate is 10Mb/s, maybe you could start with an impulse duration of 0.0000001 seconds (0.1 microsecond), measure the BER and then repeat with an increased impulse duration.
Lets first create analog data using a combination of sinusoids:
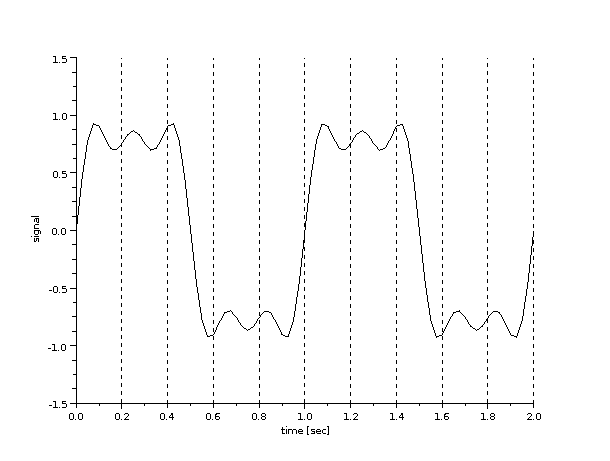
-->[analog_data] = as_create(1,1,0,3,2);

-->as_plot(analog_data);
In this example, the analog data has an amplitude multiplier of 1, fundamental frequency of 1Hz, 0 phase and 3 sine components.
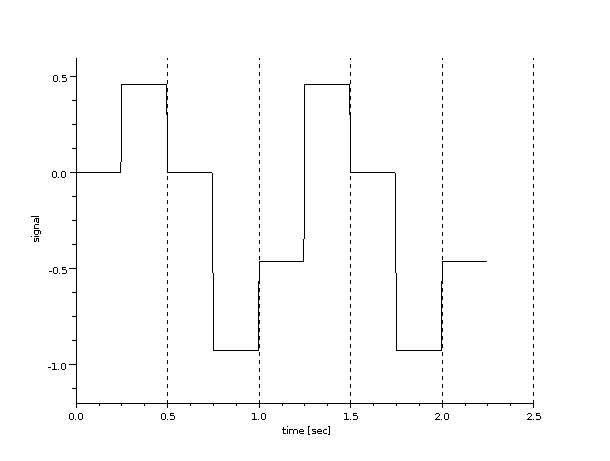
Now lets convert that analog data to digital data using Pulse Code Modulation, then convert the digital data back to analog data and plot the analog data at the receiver:
-->[digital_data, min_amp, max_amp] = pcm_encode(analog_data,4,4)
 max_amp  =

    0.9246413
 min_amp  =

  - 0.9246413
 digital_data  =


         column  1 to 12

    1.    0.    1.    1.    1.    0.    0.    0.    0.    1.    1.    1.

         column 13 to 18

    1.    0.    0.    0.    0.    1.

-->[rx_analog] = pcm_decode(digital_data,4,4,min_amp,max_amp);

-->as_plot(rx_analog)
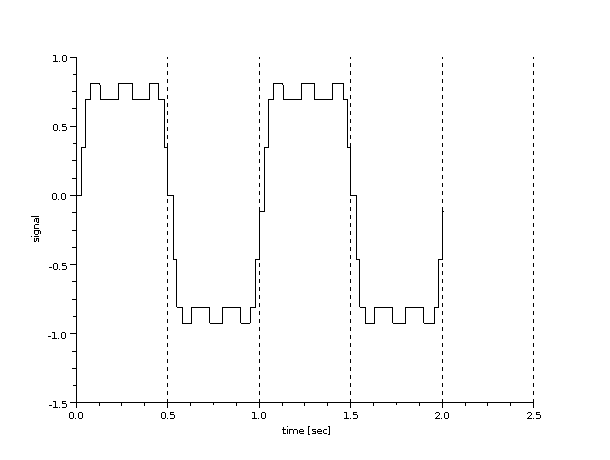
In this example as sampling rate of 4 samples/sec was used and 4 different levels. The first plot below shows the analog output at the received (assuming no noise). The second plot shows the output if a sampling rate of 100 samples/sec and 16 different levels were used. In your assignment you should investigate the impact of different values. Your explanation should use different plots to illustrate the impact. You should try sampling rates both higher and lower than the ideal Nyquist-Shannon Sampling Theorem.
Return to: ITS323 Home | Course List | Steven Gordon's Home | SIIT